
Page 18 - Hoag Orthopedic Institute 2014 Outcomes Report
P. 18
“IMPLEMENTATION OF, AND CONSISTENT ADHERENCE TO, EVIDENCE-BASED PRACTICES TO REDUCE THE
RISK OF SSI IS KEY TO SUCCESS.”
ASSOCIATION FOR PROFESSIONALS IN INFECTION CONTROL AND EPIDEMIOLOGY (APIC)
CLINICAL OUTCOMES AND INFECTION PREVENTION CONTINUED
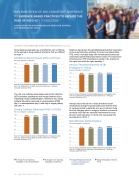
Unnecessary, prolonged use of antibiotics can contribute to the spread of drug resistant infections that are difficult to treat.
Antibiotics Discontinued within 24 Hours
Evidence has shown that prophylaxis (preventive measures) is the most effective strategy to reduce postoperative VTE, which includes deep vein thrombosis/pulmonary embolisms (potentially fatal blood clots). For maximum effectiveness, VTE prophylaxis needs to be started at the right time with the right modality.
Percent (Higher is Better)
100 97% 97% 98% 80
60
40
20 0
99.4%
Venous Thromboembolism (VTE) Prophylaxis Timing
Percent (Higher is Better)
100 98% 97% 99% 80
60
40
20 0
99.3%
Source: Hoag Orthopedic Institute Midas Reports; Comparative data from U.S. Department of Health and Human Services – HHS.gov, retrieved December 2013.
The risk of a catheter-associated urinary tract infection (UTI) increases significantly with longer duration of an indwelling urinary catheterization. Therefore, the urinary catheter should be removed on postoperative (POD) day 1 or postoperative day 2, with day of surgery being day zero.
Urinary Catheter Removed POD1 or POD2
Source: Hoag Orthopedic Institute Midas Reports; Comparative data from U.S. Department of Health and Human Services – HHS.gov, retrieved December 2013.
Abrupt discontinuation of beta blockers (heart medication) during the perioperative (around the time of surgery) period in patients who are on chronic beta blocker therapy prior to surgery leads to increased mortality. HOI met the national benchmark for beta blocker administration in 2012 and exceeded this benchmark in 2013.
Percent (Higher is Better)
100 96% 80
60
40
20
0
96%
100%
99.8%
Beta Blocker Administration
Percent (Higher is Better)
100 97% 96% 96% 80
60
40
20
0
98.8%
Source: Hoag Orthopedic Institute Midas Reports; Comparative data from U.S. Department of Health and Human Services – HHS.gov, retrieved December 2013.
Average for all reporting hospitals in the United States
Average for all reporting hospitals in California
Source: Hoag Orthopedic Institute Midas Reports; Comparative data from U.S. Department of Health and Human Services – HHS.gov, retrieved December 2013.
Hoag Orthopedic Institute Hoag Orthopedic Institute on www.medicare.gov/ FY13
hospitalcompare
18 | HOAG ORTHOPEDIC INSTITUTE
